


Solomon Hsiang shares some bad news:

Persistently reduced labor productivity may be one of the largest economic impacts of anthropogenic climate change. . . .
Two percent per degree Celsius . . . That’s the magic number for how worker productivity responds to warm/hot temperatures.
In my 2010 PNAS paper, I [Hsiang] found that labor-intensive sectors of national economies decreased output by roughly 2.4% per degree C and argued that this looked suspiously like it came from reductions in worker output. Using a totally different method and dataset, Matt Neidell and Josh Graff Zivin found that labor supply in micro data fell by 1.8% per degree C. Both responses kicked in at around 26C.
Chris Sheehan just sent me this NYT article on air conditioning, where they mention this neat natural experiment:[I]n the past year, [Japan] became an unwitting laboratory to study even more extreme air-conditioning abstinence, and the results have not been encouraging. After the Fukushima earthquake and tsunami knocked out a big chunk of the country’s nuclear power, the Japanese government mandated vastly reduced energy consumption. To that end, lights have been dimmed and air-conditioners turned down or off, so that offices comply with the government-prescribed indoor summer temperature of 82.4 degrees (28 Celsius); some offices have tried as high as 86.
Unfortunately, studies by Shin-ichi Tanabe, a professor of architecture at Waseda University in Tokyo who has long been interested in “thermal comfort,” found that while workers tolerated dimmer light just fine, every degree rise in temperature above 25 Celsius (77 degrees Fahrenheit) resulted in a 2 percent drop in productivity. Over the course of the day that meant they accomplished 30 minutes less work, he said.
Personally, I like the hot weather (as long as I’m not in a crowded bus or train), but then again I enjoy the occasional spot of low productivity.
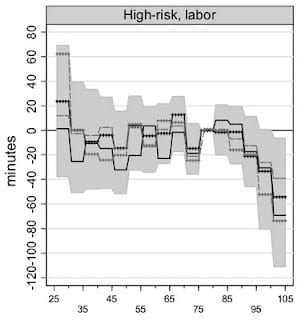
Hsiang discusses Neidell and Zivin’s paper in detail here, including the killer graphs shown above.
Matt’s graph uses micro-data from the American Time Use Survey combined with interpolated daily weather station data while mine [Hsiang’s] uses total national production from UN national accounts combined with degree-day reconstructions from NCEP reanalysis, so they are completely different data sets utilizing completely different methods, but the results look extremely similar! On hot days, output in non-agricultural sectors drops and workers work less.
Furthermore, not only do the shape of the response-functions look similar, but the magnitudes of the responses are similar. . . . Matt and Josh found time worked fell by about 1.8% per 1 C in daily mean temperature [12.5%/((39.2 C-25.3 C)/2)] while I found that national output fell by about 2.9% per 1 C in daily mean temperature [10/(30.5-27)]. . . .
Hsiang concludes:
Reductions in worker output have never been included in economic models of future warming (see here and here) despite the fact that experiments fifty years ago showed that temperature has a strong impact on worker output (see here and here). In my dissertation I did some back-of-the-envelope estimates using the above numbers and found that productivity impacts alone might reduce per capita output by ~9% in 2080-2099 (in the absence of strong adaptation). This cost excedes the combined cost of all other projected economic losses combined.