


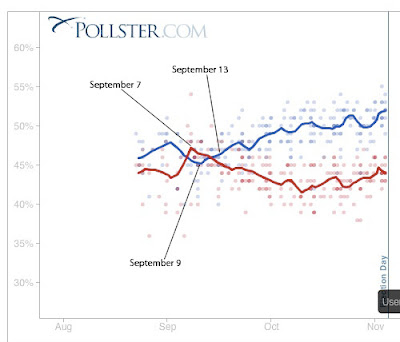
Lots of chatter, especially from the GOP that the September financial crisis did in McCain’s chances. I’m skeptical. Look at this graph from Pollster.com. It shows the poll average trendline from August 22 (the day Obama announced his pick of Joe Biden for VP) to the election. I’ve set the sensitivity to high so that it will highlight even small day-to-day changes in the polls.
 |
| From Monkey Cage |
Obama got a bit of a bounce out of his convention, but that receded pretty quickly in the face of the Palin announcement and then McCain’s convention bounce. But the graph shows that McCain topped out at about September 7 and that Obama began to bounce back two days later on September 9. By September 13, the day Lehman declared banruptcy and the crisis began to develop, Obama was already back in the lead.
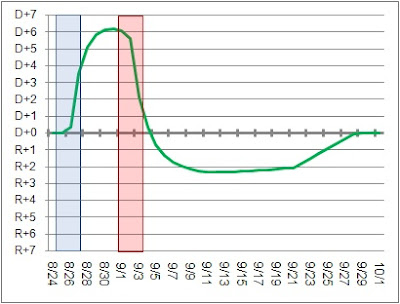
If the crisis clearly moved voters in Obama’s direction, you would expect to see a sharp break in the trendlines sometime after September 13. But you don’t. The lines pretty much stay on course from early September until early October, when McCain bottoms out and starts to come back a bit. The timing of Obama’s rise in the polls seems to suggest that it resulted from the fading of the GOP convention bounce, not the financial crisis. In fact, the graph above tracks almost exactly with the predicted impact of the convention bounces predicted by 538’s Nate Silver in the graph below:
 |
| From Monkey Cage |